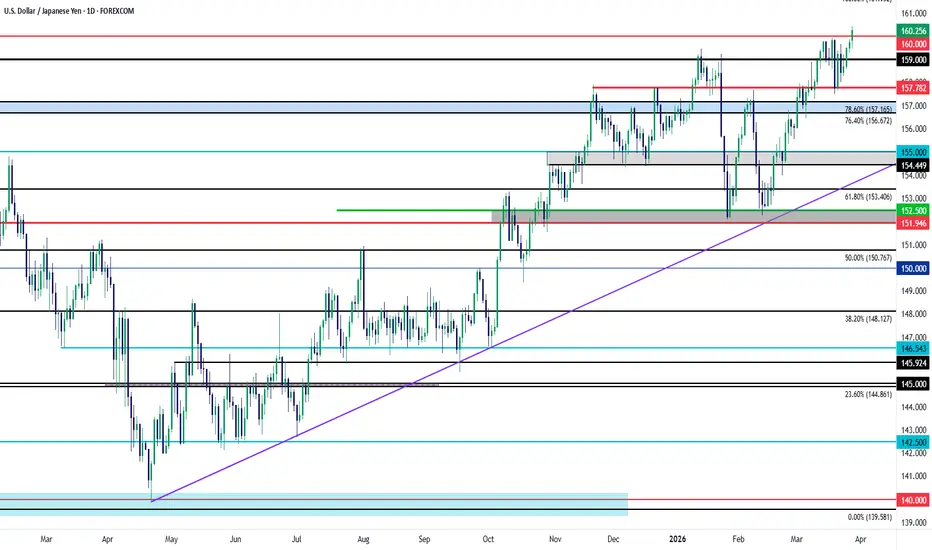
USD/JPY: The 160.00 TestFor the first time since July of 2024 USD/JPY has pushed above the 160.00 handle.
The move hit around 1am Tokyo time so we could still see a response from Japanese policymakers around the Sunday open, and interestingly, last week began with another threat of intervention that brought pullback to US

The best trades require research, then commitment.
Get started for free$0 forever, no credit card needed

Scott "Kidd" PoteetPolaris Dawn astronaut

Where the world does markets
Join 100 million traders and investors taking the future into their own hands.
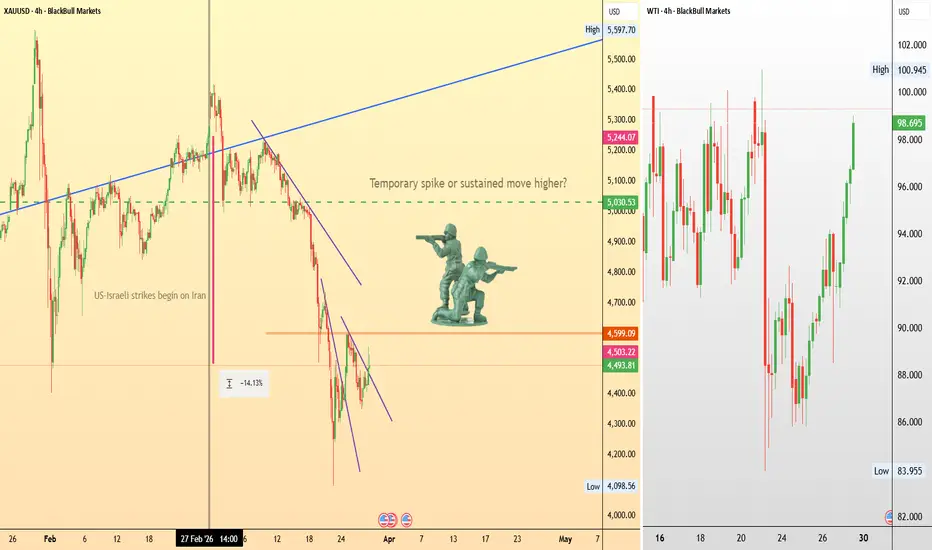
Will a ground invasion finally move gold?From a technical perspective, gold is currently in a clear short-term downtrend following the initial geopolitical spike. Gold appears to be waiting for a stronger catalyst.
Are ground troops what gold needs to start moving upward?
Iran has claimed it could mobilise more than 1 million troops to
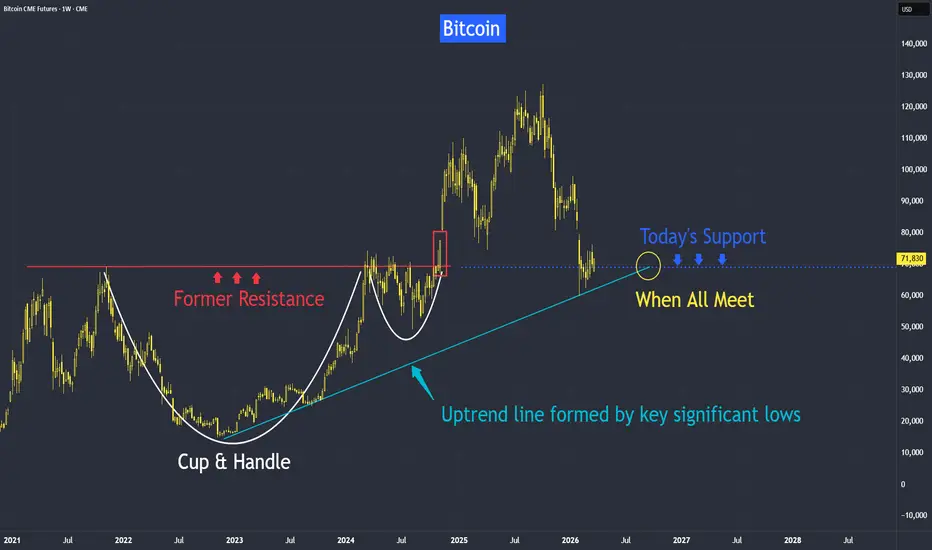
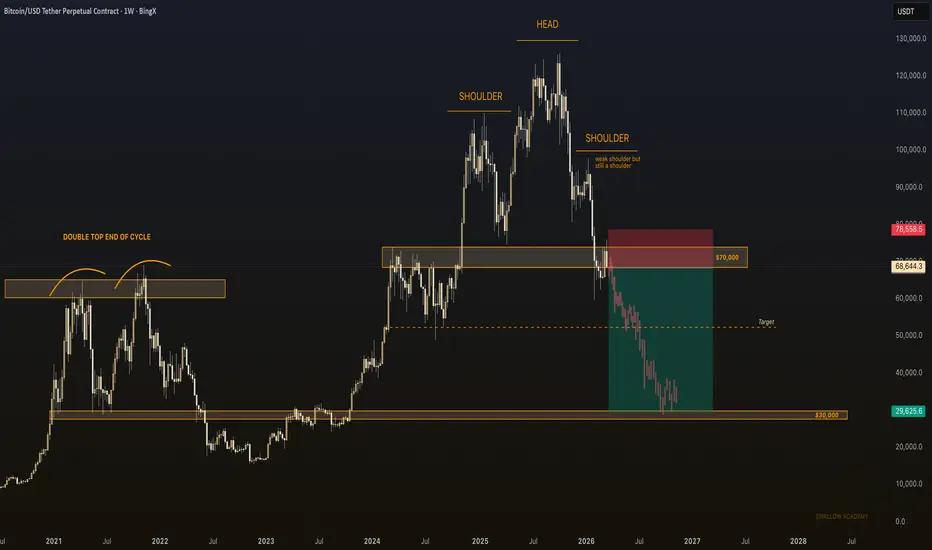
Bitcoin Key Support Level at 70,000It has fallen from last year's highs, but technical support could be near, and also supported by several fundamental factors.
Let me first touch on two key fundamentals before covering the technical aspects.
1) Regulator creating a friendlier environment - with new SEC rules and upcoming legislati
Silver Analysis: Which Direction Is Next?Before anything else, it’s important to note that silver, unlike gold, tends to have sharp and aggressive corrective moves. This makes it a bit more challenging to trade, so proper risk management and caution are essential when dealing with it.
From the point where we placed the red arrow on the ch

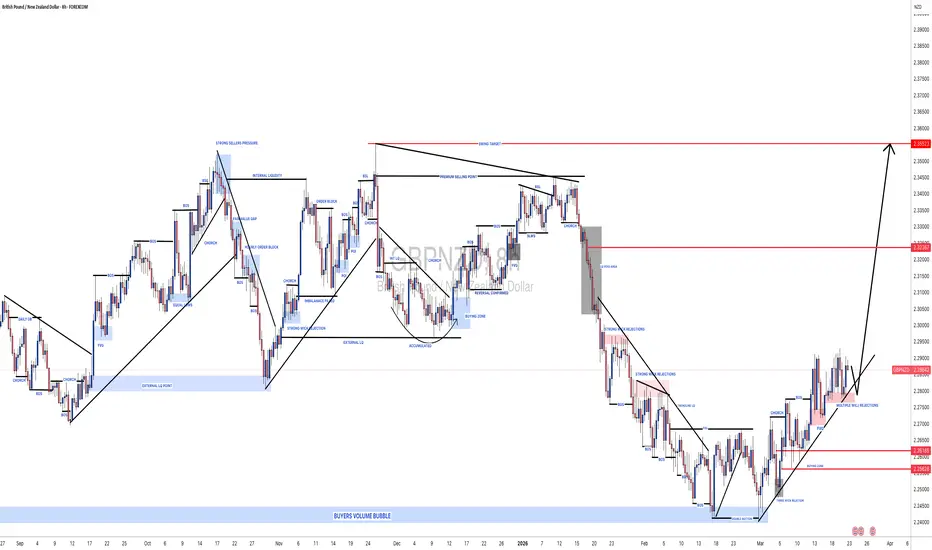
#GBPNZD: Two Targets, Once Strong Bullish Entry! ✴️ The GBP/NZD pair demonstrated a favourable reversal upon reaching our designated buying zone at 2.256, currently trading at 2.287. This indicates potential for continued upward momentum. We anticipate the price may advance towards the 2.32 level where a liquidity void is expected to be addressed.
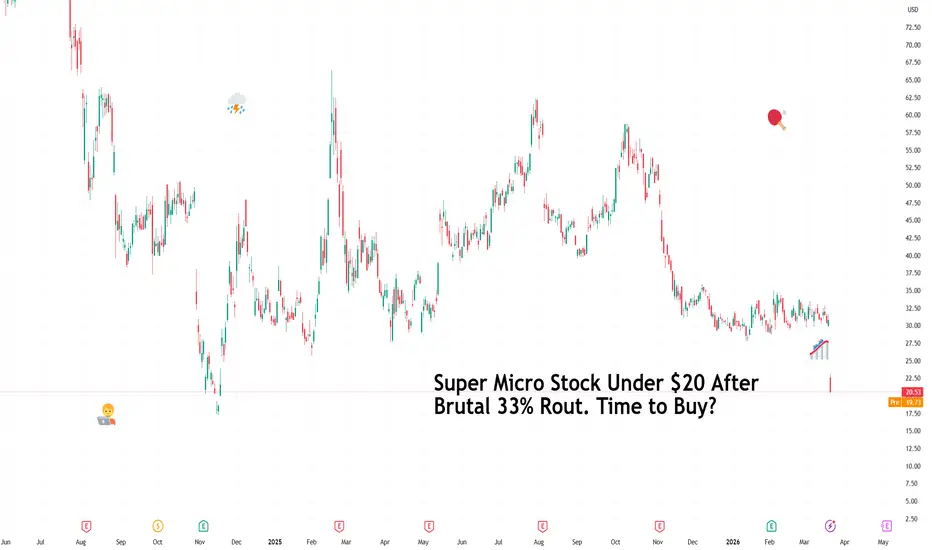
Super Micro Stock Under $20 After Brutal 33% Rout. Time to Buy?If only there was a way to track where things went wrong.
The board of directors at Super Micro NASDAQ:SMCI got together one day in the boardroom and decided it’s a good idea to bring back the same executive who had already resigned once over an accounting scandal.
They voted to hire him as a
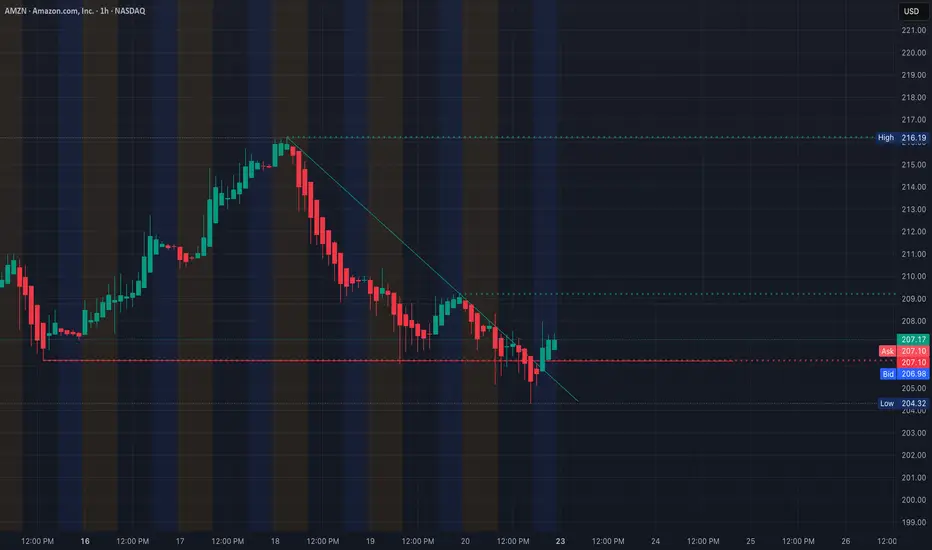
AMZN Holding Range - Waiting for Direction. Mar. 23Looking at AMZN right now, price is coming off a selloff but starting to stabilize around the 205–207 area.
This looks like a base forming, but it’s still sitting right under a key resistance zone.
1H Structure - Downtrend Trying to Slow
On the 1H chart, AMZN has been trending lower with consistent
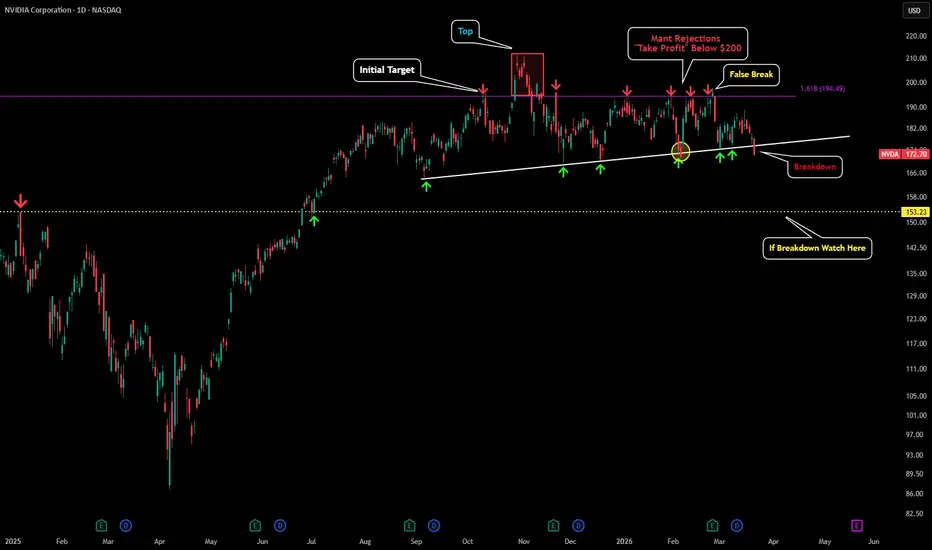
NVDA - On Verge of Breakdown This is an update to my last post:
I have been monitoring this trendline for quite some time, and with Friday's close, NVDA has broken below a trendline it has been holding for the past six to seven months which is a significant development.
It is possible for NVDA to reclaim this trendline on Mo
Bitcoin | We Are Officially In Bear MarketThe structure of Bitcoin is telling us just one thing: we are going to keep moving to lower zones from here on; we are in a bear phase of the markets.
Now saying that we are in bear markets is a little extreme, some might say but let's face the facts here: this bull market we had was never suppose
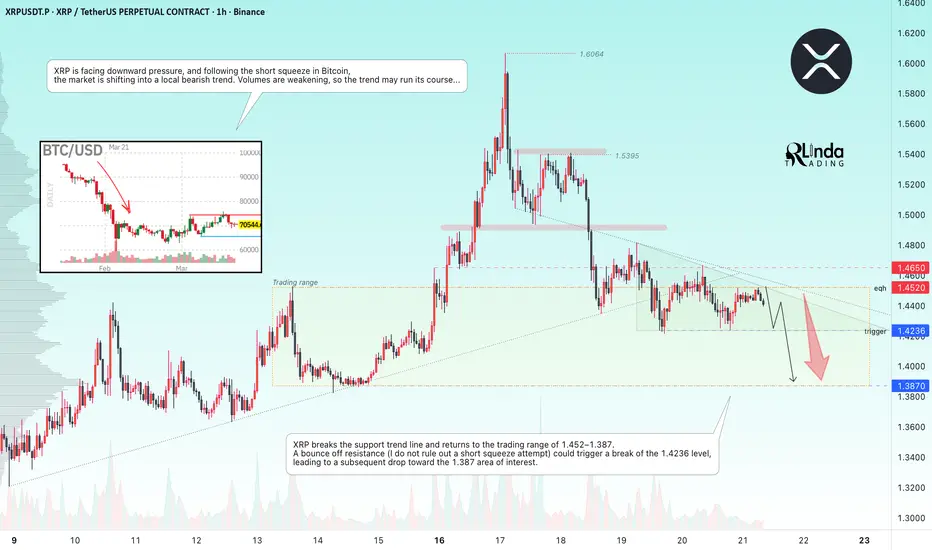
XRPUSDT - A break in the uptrend. Are we heading toward 1.380?BINANCE:XRPUSDT has broken through the uptrend support and is consolidating below 1.450, indicating that the market is poised to head toward support. Crypto winter continues...
XRP is facing downward pressure, and following a short squeeze in Bitcoin, the market is shifting into a local bearis
See all editors' picks ideas
TASC 2026.04 A Synthetic Oscillator█ Overview
This script implements a Synthetic Oscillator as presented by John F. Ehlers in the April 2026 TASC Traders' Tips article "Avoiding Whipsaw Trades". The indicator aims to provide a smooth, low-lag oscillator for timely trading signals by dynamically mapping a sine wave to price data
Pine Script® indicator

Volume Spread Analysis IQ [TradingIQ]Hello Traders!
🔹Volume Spread Analysis IQ
This indicator was most voted on for our indicator competition - so here it is! Hope you guys like it :D
Volume Spread Analysis IQ is a chart-reading tool built to help traders judge effort, result, and background context in a way that is visual and
Pine Script® indicator

Market Microstructure AnalyticsThe Hidden Toll on Every Trade
Every time you buy or sell a financial instrument, you pay a cost that never appears on your brokerage statement. It is not a commission. It is not a fee. It is the spread between the price at which someone is willing to sell to you and the price at which someone is
Pine Script® indicator

Fair Value Gap Profile + Rolling POC [BigBeluga]🔵 OVERVIEW
FVG Profile builds a price-level profile based on detected Fair Value Gaps (FVGs) over a fixed lookback period.
Instead of measuring traded volume alone, this tool aggregates bullish and bearish FVG occurrences into horizontal bins, allowing traders to see where price inefficienci
Pine Script® indicator

PineScript integration with Notepad++ (UDL)THIS IS NOT AN INDICATOR!
This is PineScript integration with Notepad++ text editor (NPP). It supports PineScript v6 as of January 2026. Provides autocompletion, function list and syntax highlighting for *.pine files.
Why would anyone need this?
Pine Editor doesn't provide function list yet
Pi
Pine Script® indicator

Machine Learning Pivot Points (KNN) [SS]Hey everyone,
Been working on this one for a very long time.
1. What It Is: The Geometric DNA of a Pivot
Machine Learning Pivot Points (KNN) is a predictive structural tool that moves away from traditional lag based oscillators. Instead of waiting for a moving average crossover, this system t
Pine Script® indicator

Market Structure Volume Profiles [Kioseff Trading]Hello traders and friends!
Introducing: "Market Structure Volume Profiles".
This script combines market structure with volume profiling and CVD to show how volume develops inside each structural changes of the market.
Instead of building one continuous profile across a session, this script create
Pine Script® indicator

Liquidity Thermal Map [BigBeluga]🔵 OVERVIEW
Liquidity Thermal Map visualizes where the highest traded volume has accumulated across price levels over a fixed lookback period.
Instead of plotting classic volume profiles with bars, the indicator builds a horizontal thermal heatmap directly on the chart, highlighting areas of
Pine Script® indicator

VIX Curve Pro - Real-Time Term Structure with StatisticsThis indicator displays the VIX term structure as a spatial curve directly on the chart, allowing you to instantly identify whether the volatility market is in contango or backwardation.
It shows the relationship between different VIX maturities (9D, 30D, 3M, 6M, 1Y) as a single curve.
It also sh
Pine Script® indicator

Stop Loss Cascades (Breakouts) [Kioseff Trading]Hello friends and traders!
🔹Introduction
This indicator " Stop-Loss Clustering (Breakouts) " attempts to model trader stop-loss placement logic and identify price areas where a large amount of stop losses might cluster.
The idea is, if stop losses are indeed highly concentrated in a specific are
Pine Script® indicator

See all indicators and strategies
Community trends
Banks Are Sending a Signal — $JPM at a Key Decision LevelBanks tend to move first when liquidity conditions shift, and right now JPMorgan Chase is sitting at a level that could determine the next directional move for the sector.
With uncertainty around rate cuts and pressure in private credit, I’m watching this closely.
⸻
Technical Setup (The Strat + S

OBV Z 2.95 Inflow, Price at 99.6% CeilingXOM is a stock-only instrument with no futures market on this feed and no spot-to-futures ratio to assess. Dollar volume at 5.19B — heavyweight institutional participation. Price at 99.6% of its annual range, tagged Ceiling, one dollar below the all-time high of 171.23. The signal stack is running a

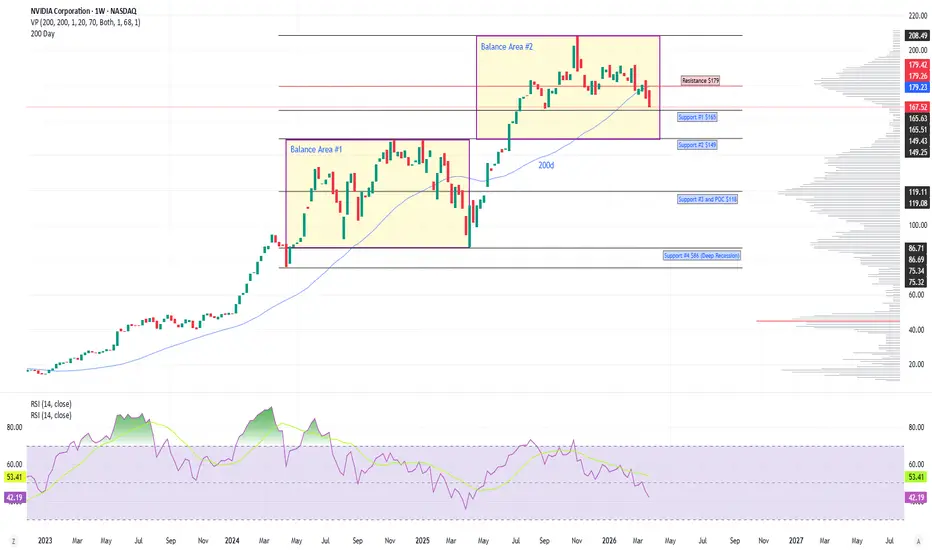
NDVA weekly view. Headline risks.Nvidia has been pulling back from the $190 level since the start of the war and is currently sitting below the 200d sma. Big tech is under pressure from rising oil prices, a stronger dollar and a possible self-induced recession if oil prices remain elevated. I have outlined two balanced area's on th
MsftWent through over this stock thoroughly on every time frame...
To make a long story short I think we make 1 more low around 334-339.
It's too much technical support around 330's
Fib support - 2020 lows + All time high
Trendline support from from 2019 .
Wedge support created from Ath sell off
I

NVIDIA (NVDA) – Daily Timeframe AnalysisOverall Structure
• The market is forming a distribution structure
• Your marked pattern resembles a Head & Shoulders / Lower High sequence
• Price is breaking or about to break the ascending trendline
👉 This is a major potential trend shift signal
Bearish Scenario (Primary Bias)
• Formatio

APPLE: Long Signal with Entry/SL/TP
APPLE
- Classic bullish formation
- Our team expects pullback
SUGGESTED TRADE:
Swing Trade
Long APPLE
Entry - 248.65
Sl - 247.43
Tp - 251.56
Our Risk - 1%
Start protection of your profits from lower levels
Disclosure: I am part of Trade Nation's Influencer program and receive a monthly f

NVIDIA - Main PlanNASDAQ:NVDA stock formed its peak at the end of October 2025. All price action since then is considered corrective.
The primary scenario remains bearish - a move down toward the start of the fifth wave. The only question is the structure of the correction.
It’s possible that the main downside m

First Pullback then up? It didn’t reach the desired level, but we still got 5 waves.
Now I’m looking at a pullback down toward the 0.5–0.618 Fibonacci level, and after that we’ll see what happens.

Tesla - Does minor A need another lowLooking at the depth of the retrace made last Friday, I am left wondering if minor A is complete or not. I was counting the drop from the 11 March high as a 5-wave move. However, it could also be considered another smaller degree abc pattern with the micro-C-wave being carved out now. Price has alre

WBI: 5-Month Cup & Handle – IPO Base BreakoutThe Setup:
NYSE:WBI is emerging from a massive 5-month Cup and Handle base, which also serves as its primary IPO Base . The stock is making a powerful move into blue-sky territory, triggering a definitive Green line breakout! Within the handle of this structure, we can see a tight VCP (Vol

See all stocks ideas
Today
GNEGenie Energy Ltd.
Actual
—
Estimate
0.07
USD
Today
GOCOGoHealth, Inc.
Actual
—
Estimate
−2.02
USD
Today
ICLRICON plc
Actual
—
Estimate
3.22
USD
Today
GOVXGeoVax Labs, Inc.
Actual
—
Estimate
−3.97
USD
Today
EMPDEmpery Digital Inc.
Actual
—
Estimate
—
Today
CELUCelularity Inc.
Actual
—
Estimate
−1.50
USD
Today
STSSSharps Technology Inc.
Actual
—
Estimate
−0.65
USD
Today
RVSNRail Vision Ltd.
Actual
—
Estimate
—
See more events
Community trends
BTCUSDT: Weak Structure Signals Move Toward 65.5KHello everyone, here is my breakdown of the current BTCUSDT setup.
Market Analysis
BTC is trading inside a triangle, with descending resistance and rising support. Price failed to hold above the 67,400 supply, confirming strong resistance.
Currently, price is trading below resistance and approac

ETHUSDT - The crypto winter continues. Support has broken down BINANCE:ETHUSDT is forming a counter-trend correction after hitting new lows. The market is reminded that it is still in crypto winter and may continue to fall...
Bitcoin is returning to a downtrend after a failed attempt to retest the 72K zone. Bears are dominating, and the downtrend continue

Bitcoin—BTCUSDT 25X—Long trade-numbers with 2,058% potentialBitcoin dropped from a high of $76,000 to a low of $65,550, a strong retrace by any standard. The low level is a perfect support from 8-March, double-bottom and also intermediate higher low.
You know the old axiom: Sell at resistance, buy at support.
Bitcoin is now trading at support.
I am not say

Lingrid | BTCUSDT Liquidity Swept Below. Potential Bullish MoveBINANCE:BTCUSDT recently swept liquidity below support at 66K - 65K before quickly rebounding back inside the structure. Price is now compressing near a key support intersection where the market could begin building momentum for a recovery move.
📍 If buyers defend the current support zone, price c

Bitcoin - 60k is coming sooner than you think!Bitcoin is currently trading around $66,000 after a significant drop from the highs, and the market is once again showing signs of weakness. While there has been a temporary recovery, price action remains corrective rather than impulsive. The structure suggests that BTC is still struggling to regain

Key Wyckoff Events for Cardano + VolumeThe Wyckoff Method analyzes market cycles through four main phases—Accumulation, Markup, Distribution, and Markdown—driven by institutional "smart money". It uses five distinct phases (A-E) and specific events like Buying/Selling Climaxes and Springs to identify entry/exit points, acting on the laws

BTC/USD IDEA 📊 My Overall Bias
Short-term: Bearish / corrective phase
Mid-term key levels:
• Resistance: 90k – 98k
• Support: 70k
• Major demand: 40k
⚠️ If 70k fails, the drop could accelerate quickly.

BTCUSD Bullish Setup (4H)Bitcoin is showing signs of downtrend exhaustion after an extended sell-off, with price reacting strongly from support and attempting to build a base.
🔺 Bullish Confluences
Higher low forming after a sharp impulsive move down.
Strong reaction from the lower band / key support zone.
Price attemptin

Bitcoin Weak Demand at 67.4K — Sell-Side Liquidity in FocusHello traders! Here’s my technical outlook based on the current BTCUSDT (1H) chart structure. Price previously moved inside an ascending channel, forming higher highs and higher lows until a clear rejection at the upper boundary signaled a loss of bullish momentum. After that, BTC broke down from th

Bitcoin showing strong market structureBitcoin is currently showing strong market structure after holding key support zones and maintaining higher price levels. The recent price action suggests that BTC is not weak — instead, it is building momentum for a potential bullish continuation.
Bitcoin correction phase, Bitcoin is consolidating

See all crypto ideas
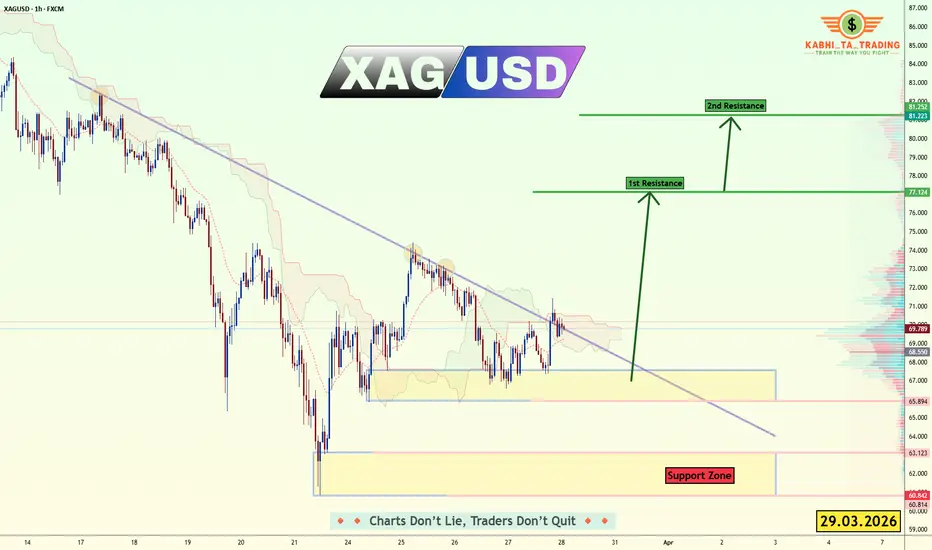
XAG/USD - Breakout Watch – Silver Ready for a Bullish Expansion?📊 Description & Setu p FX:XAGUSD
XAGUSD is currently consolidating within a strong support zone after breaking out of a major descending trendline on the 1h chart. If we see a decisive bounce and sustained momentum from this base, it opens the door for a high-probability play toward our upper res
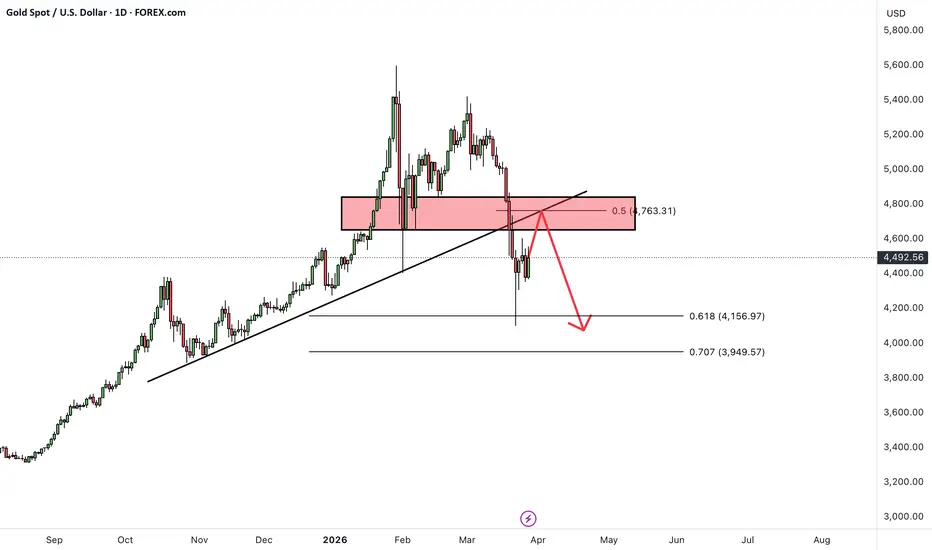
XAUUSD Rejection at 4,550 Signals Downside Risk To 4,390Hello traders! Here’s my technical outlook based on the current XAUUSD (4H) chart structure. Price moved inside an ascending channel before a rejection at the top signaled a shift. A break below channel support confirmed bearish structure. Currently, gold is trading below the 4,550 resistance (selle

XAU/USD Selling Pressure Big Move IncomingGold is trading inside a descending channel, showing strong bearish 📉 pressure after multiple rejections at resistance. A clear head and shoulders pattern has already played out, followed by confirmed bearish 🔥 breakouts, strengthening downside momentum. Price continues forming lower highs and lower

XAUUSDHello Traders! 👋
What are your thoughts on Gold?
Following a strong bullish rally, Gold has entered a corrective phase. The breach of the ascending trendline provides a clear signal that the previous bullish structure is weakening. Currently, the price is performing a pullback toward a key conflue
Gold 30M Bullish Structure Holding Above SupportGold has shifted into a short-term bullish structure after a CHoCH, with price holding above the rising trendline support. The market is consolidating near support while maintaining higher lows, suggesting potential continuation to the upside.
Bullish continuation: if price holds the 4,485–4,465 s

Gold 30Min Engaged ( Bearish Entry Detected )⚡Base : Hanzo Trading Alpha Algorithm
The algorithm calculates volatility displacement vs liquidity recovery, identifying where probability meets imbalance.
It trades only where precision, volume, and manipulation intersect —only logic.
✈️ Technical Reasons
/ Direction — SHORT / Reversal 4570
☄️B

XAUUSD Bearish Continuation from Descending ChannelThe chart shows XAUUSD trending downward within a clear descending channel, confirming sustained bearish momentum. After multiple lower highs and lower lows, price continues to respect the channel structure. A recent pullback failed to break higher, indicating selling pressure remains dominant.
Pri

GOLD WEEKLY CHART MID/LONG TERM ROUTE MAPHi everyone,
Please take a look at my weekly chart idea, which highlights our unique ascending Goldturn channel.
Previously we saw the channel floor tested with precision, followed by a bounce. This week the weekly candle briefly closed outside the channel with a drop first but ultimately wicked b

Bearish Rejection from Key Resistance – XAU/USD Short Setup🔍 Market Structure Assessment
Price action reflects a corrective pullback within a broader bearish context. The inability to produce higher highs, combined with choppy consolidation beneath resistance, signals distribution rather than accumulation.
🟥 Supply Zone Dynamics
The highlighted resistanc

Gold Weekly Levels: Get ready for Volatility 4400/4600 USD🔱 GOLD WEEKLY SNAPSHOT — EXECUTIVE SUMMARY
⚖️ Gold closed the week at 4495 USD, establishing a neutral outlook for the days ahead
🔄 Expect a two-sided market, focusing on trading fresh liquidity levels above and below the current price
🔺 Key Bearish OB resistance zones: 4555, 4590, and 4630 — watch

See all futures ideas
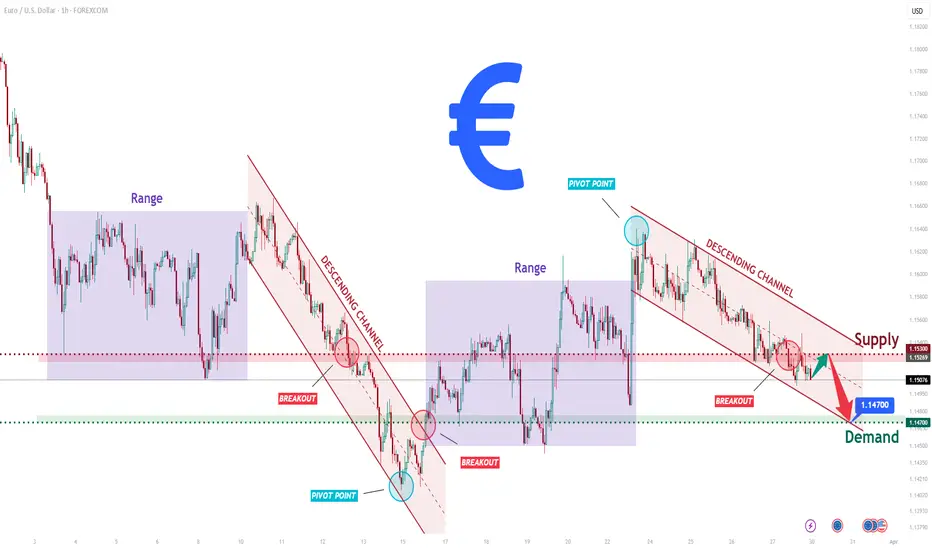
EURUSD Short: Bearish Channel Holds - Price Target 1.1470 DemandHello traders! Here’s my technical outlook based on the current EURUSD (1H) chart structure. EURUSD moved from a consolidation range into a descending channel, forming lower highs and confirming bearish pressure. After a brief range, price was rejected from a pivot high and continued lower.
Current
#AUDUSD: One Entry Zone, Two Targets, Bulls Comeback Soon✴️ The AUDUSD currency pair has recently shifted from a bullish to a bearish trend, evidenced by a significant change in character and a series of structural breaks. This decline commenced after the price reached the 0.7200 level. Since then, the price has consistently failed to find support, contin

GBPUSD Breakout and Potential Retrace!Hey Traders, in today's trading session we are monitoring GBPUSD for a selling opportunity around 1.32900 zone, GBPUSD was trading in an uptrend and successfully managed to break it out. Currently is in a correction phase in which it is approaching the retrace 1.32900 zone.
Trade safe, Joe.

Market Overview (EURUSD – 1H)Price is currently in a short-term bearish structure after sweeping liquidity from the previous highs (BSL). The market has shown clear displacement to the downside, followed by a controlled pullback.
Structure shifted bearish after strong impulse
Lower highs + weak retracements forming
Price react

GBP/CAD – Triangle Rejection & Bearish ContinuationGBP/CAD is currently showing a clear rejection from a strong supply zone combined with a failed triangle breakout, indicating growing bearish pressure. Price attempted to push higher multiple times but sellers defended the resistance area aggressively.
The structure shows lower highs forming after

EURUSD: Support & Resistance Analysis for Next Week 🇪🇺🇺🇸
Here is my latest structure analysis and important
supports and resistances for EURUSD for the next week.
Consider these structures for pullback/breakout trading.
❤️Please, support my work with like, thank you!❤️
I am part of Trade Nation's Influencer program and receive a monthly fee for us

EURNZD: The Bullish Trend ContinuesEURNZD: The Bullish Trend Continues
From our previous analysis on Friday EURNZD reached the first target and is going up in clear way.
The broken resistance is not turned into support by rising the chances to push the price up even more during the coming days.
The Economic calendar is almost em

30.03.26 Daily ForecastPairs on Watch -
FX:EURUSD : Currently short on this pair after the multiple 1H rejections at the V shape. I am aiming for the lows as my main target and will be keeping a close eye on the DXY movements. I may have to manage aggressively if need be which is fine, as the positioning is good but t

USDCHF - NEW BREAKOUT!Hello traders,
as discussed in the previous analysis, USDCHF has formed a rectangle pattern.
Currently, the resistance level (0.79582 – 0.79230) has been broken,
and this zone may now act as a new support.
Based on this breakout, I expect a bullish move.
🎯 TARGET: 0.80050

EUR/USD Bearish Channel Breakdown – Targeting Demand ZoneThis 1-hour chart of **EUR/USD** shows a clear transition from a short-term bullish reversal into a sustained bearish structure.
After forming a **double bottom**, price pushed higher and created a **break of structure (BoS)**, signaling bullish intent. However, that momentum failed to continue, an

See all forex ideas
Trade directly on Supercharts through our supported, fully-verified, and user-reviewed brokers.


